CONVERSIONS VS. TRAFFIC…
$281.88 VS. $40.77347
CONVERSIONS AGAINST 148 LINK CLICKS!
Ladies & Gents, you be the judge on the winner!

Happy Sunday Funday friends!
Amidst these organ and limb pricing we are all facing with conversions currently, I decided to embark on 2 different tests. One test was to figure out how soon can I hit 1000 streams with higher adspend and marketing to tier 1 only countries (6 countries to be exact) with focused targeting such as my target audience on Spotify 23-37 which are a bulk of my traffic, $45 for the first 2 days, and then $25 afterwards.
My second test, to explore campaigning to 12 tier 1 countries at $10 a day with the traffic objective.
1st test ran for 7 1/2 days while my second test (which is currently running) has ran for 3 1/2 days.
THE FACTS:
As I’m sure you know by now, conversions are considered to be Facebook’s most expensive service in their ad inventory. Conversions were designed to track products, services, appointments, and anything else that the consumer can purchase in a e-commerce/online store kind of situation, there’s also a feature called “offline tracking” which is a whole other post I’d need a whole day to get into, but for sake of time, conversions are what we all use to grow on our preferred choice of DSP (digital service provider).
For our focus, conversions are preferred over to traffic, because we are all focused on the QUALITY OF THE CLICK.
Example:
User watches ad. User clicks ad. User lands on landing page. User clicks play on landing page. User listens to song for 30 seconds or more. Stream is now counted. If the user clicks on that play button based on the custom behavior or in this case “custom conversion” then when they click on the play button from the landing page, that is counted as a conversion.
Traffic: clicks can be counted from anywhere. They click anywhere on the Spotify page without a custom conversion set in place, the click is then counted. This is horrible…Right? Well this is why we prefer conversions over traffic,
but… until recently decided to put this to the test…
Nostalgic to the days before this IOS14 monkey wrench, we’d see guys like John, Andrew, Tom, and many others trail blaze with 1000000’s of streams and wanted in on the holy grail of spotify growth? Reading, researching, reviewing, trial and erroring, etc. I think I too, saw a bit of those magical unicorns of Spotify data gallop across the stat terrain so proudly and reminding me that it’s possible as well. Then IOS14 comes in, cuts our traffic by 4X, throw up a “ask to app track” box and the flood gates turn into small puddles and streams… ![]()
I’ve been testing, testing, and testing again, by the way, STILL TESTING, to see what could come from this and where we could go. Even though all of my tests only focuses on places like USA, Canada, and Germany to name a few, I hope that these post results will in still confidence and reinforce the importance of DATA.
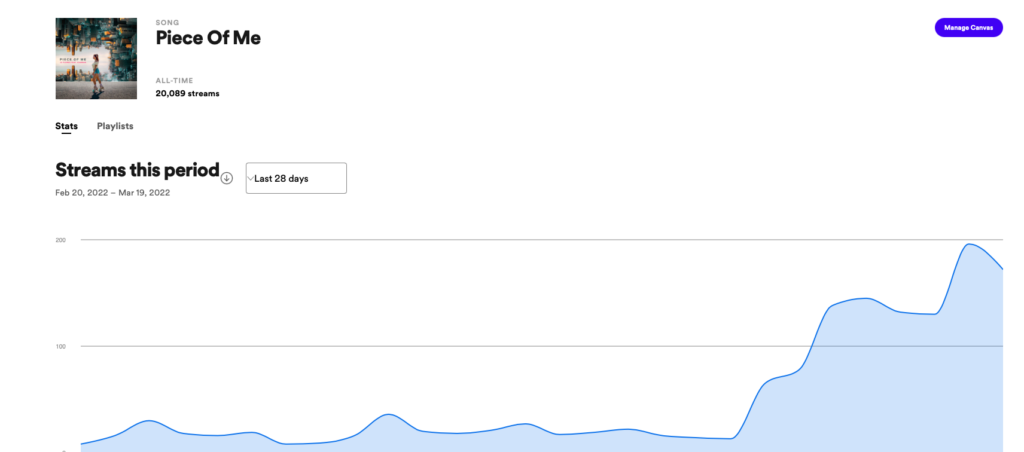
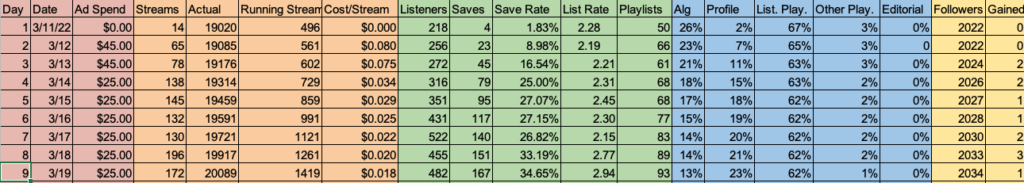
On March 11th, at midnight I set up a campaign for a song I released on November 19th, 2020 called Piece of Me. The adsepnd on this campaign ran me down a $281.88 hole, much like our gas prices currently. Basically this would equate to 4 1/2 full tanks of gas for my car. SMH…
Anyways before I started, the song was at 19020 streams, 4 saves, 50 playlists, and I had 2022 followers. Results after: 1400% increase in streams, total: 20089 streams | 482 listeners | 167 saves | 43 more playlists adds | 2034 followers ( 12 more followers ) Popularity score: Still a 13.
I ran this at the adset level and tried out different audiences that work best with my music, the ad copy I wrote for it, the placements, and the visual.
For those that are concerned about my visuals you can view an example of 1 I designed here: https://vimeo.com/manage/videos/587630408
Adspend began at $45 a day for 2 days and then I brought it down to $25 a day afterwards. If I was running the campaign to places like Mexico or Brazil, I’m sure my cost per conversions would have been way less than what you are seeing now, but I’m a tier 1 guy through and through. Eventually when I hit PLATINUM on that new plan to bring my costs down again, I”ll be sure to throw a few tips here in the group.
The WAY OUT OF LEFT FIELD HIT:
Example of video ad I created for Bum Bum you can view here: https://vimeo.com/manage/videos/690322389
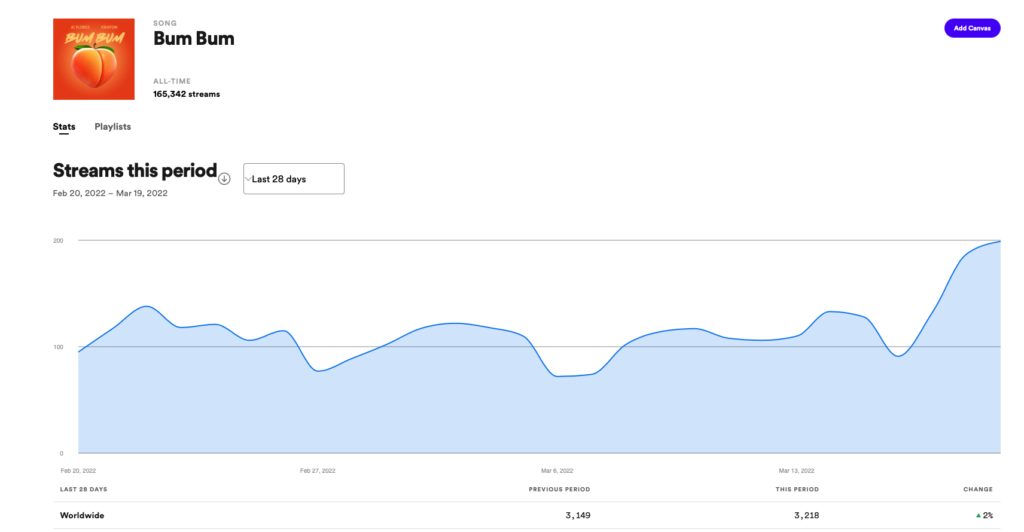
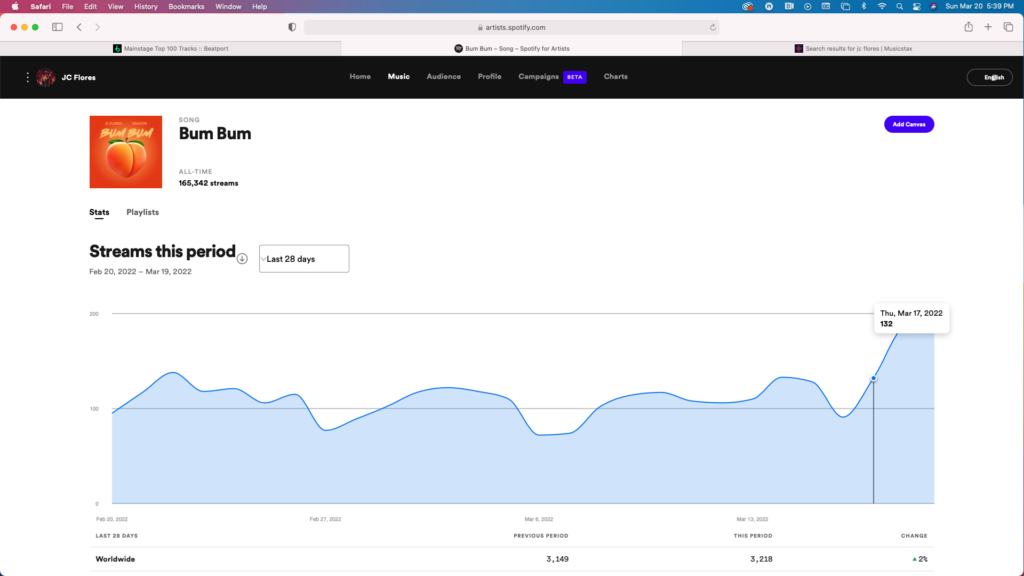
So I decided to run a test to traffic on a song I released on OCtober 20th, 2020 called Bum Bum. It’s a electro bigroom and melbourne kind of vibe. I ran this campaign at the campaign budget optimization level. Cost per link click trails between .16 – .20 and doesn’t go through a landing page. Straight to song link only. CRAZY I know, but we are in trying times guys. Whether we invest $5-100 or more, it’s expensive to run campaigns. I know, but with the data that comes from these campaigns we can do many other things.
In 3 1/2 days with a traffic campaign, going straight to spotify, marketing to tier 1 only of 12 countries, my cost per click is cheaper by more than half, and from the pictures you’ll see below is now neck and neck with my song piece of me that ran at $25 a day (I shut off the campaign at the time of you guys reading this post) and the engagement has been going up.
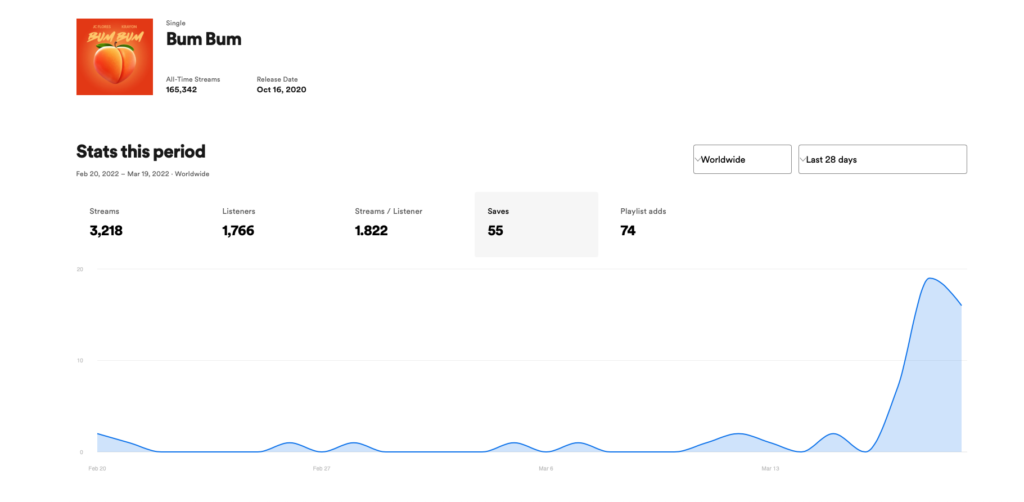
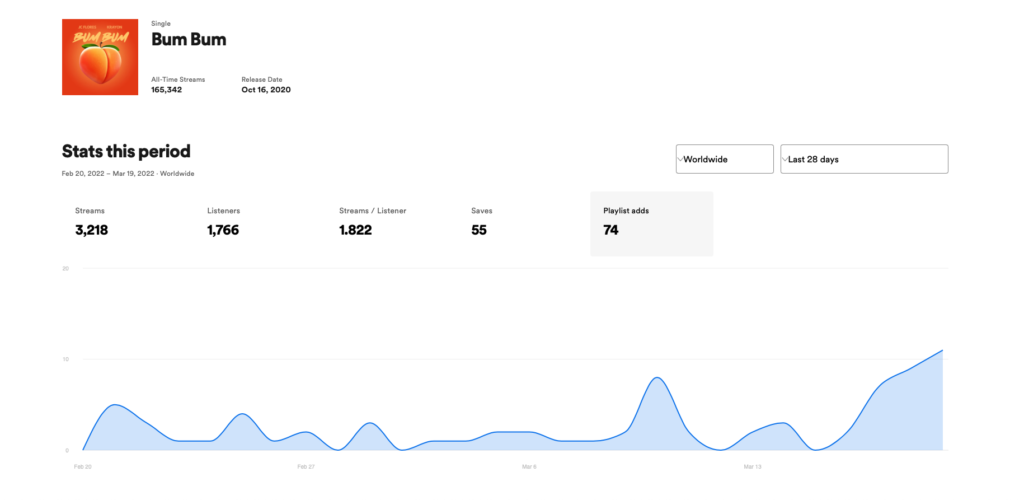
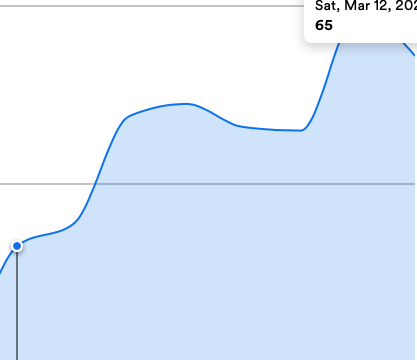
Aside from this, engagement such as saves, playlists ads, and listens have gone up as well. ![]() Crazy! I KNOW!The bumps you will in the screen shots provide when I exactly I started running both campaigns and also provide what both songs were doing before I jumped in the drivers seat and began discovering possibilities in creating newer opportunities for both songs.
Crazy! I KNOW!The bumps you will in the screen shots provide when I exactly I started running both campaigns and also provide what both songs were doing before I jumped in the drivers seat and began discovering possibilities in creating newer opportunities for both songs.
FINAL SCORE:
Piece of Me:
20089 streams ( 1K + more streams ) | 482 listeners (264 more listeners) | 167 saves (163 more saves) | 93 playlists adds ( 43more) | 2034 followers ( 12 more followers )


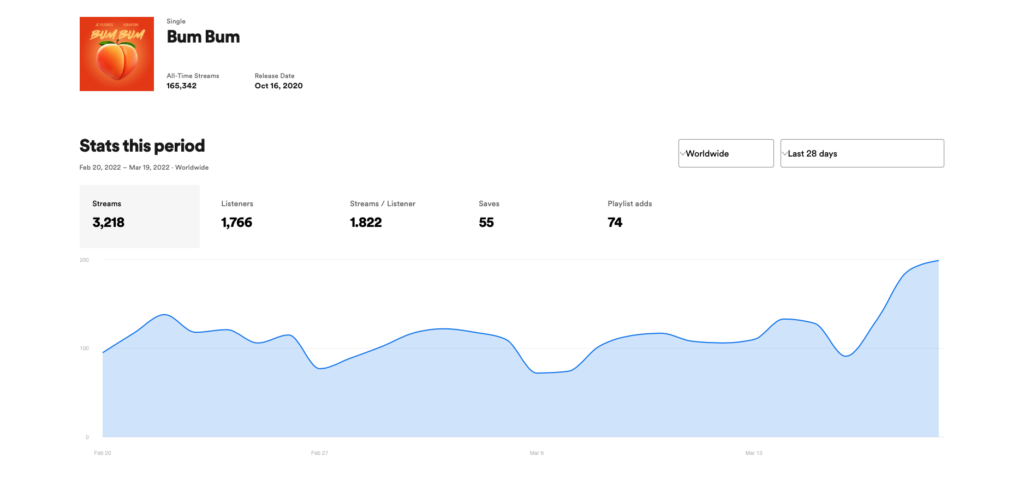
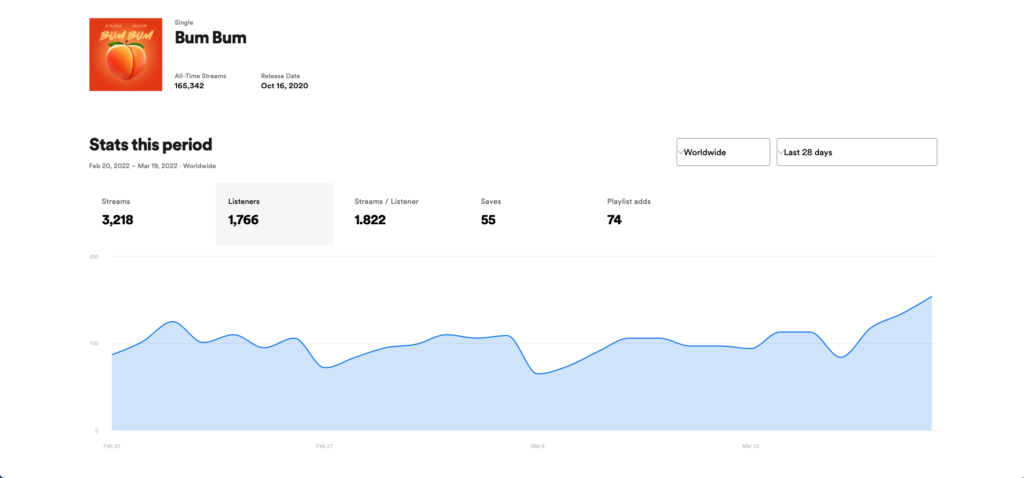
BUM BUM:
165,342 streams (518 more in 3 1/2 days) 55 saves (42 more saves) 1766 listenres (406 more) 74 playlists ( 29 more playlist ads ) Which campaign do you think won?